
What you’ll learn
- How to wire the Vite plugin and open the browser dashboard at
/.devtools - How to mount the in-page Tweakpane via
createPane/usePanewith the auto-cycling stats graph - How to register custom CPU arrays and GPU textures in the dashboard with
registerDebug*
three-flatland ships a unified devtools system: a vite plugin plus a browser dashboard for live performance monitoring and per-frame instrumentation, and an in-page Tweakpane pane (createPane / usePane) that auto-mounts a cycling FPS/MS/GPU/MEM graph and a compact stats row. Both surfaces talk to your scene over the same BroadcastChannel bus — your scene is the provider, the dashboard and the pane are consumers. The producer side stays decoupled from any UI; you can run either, both, or neither.
Try it
Section titled “Try it”The lighting example is running below — click the button to pop the dashboard into a new tab. Move it to a side window, then drive the example: drag a torch, toggle a preset, scrub the slime count. Every counter updates in real time.
If you’ve never opened the dashboard before, that’s the loop — your scene is the provider, the new tab is the consumer, and the bus connects them automatically because they share an origin. Most performance questions answer themselves once you can see the graph.
When enabled, your scene exposes per-frame stats (FPS, CPU ms, GPU ms, draw calls, triangles, geometries, textures, heap), the active batch list, and any custom CPU buffers or GPU textures you choose to register.
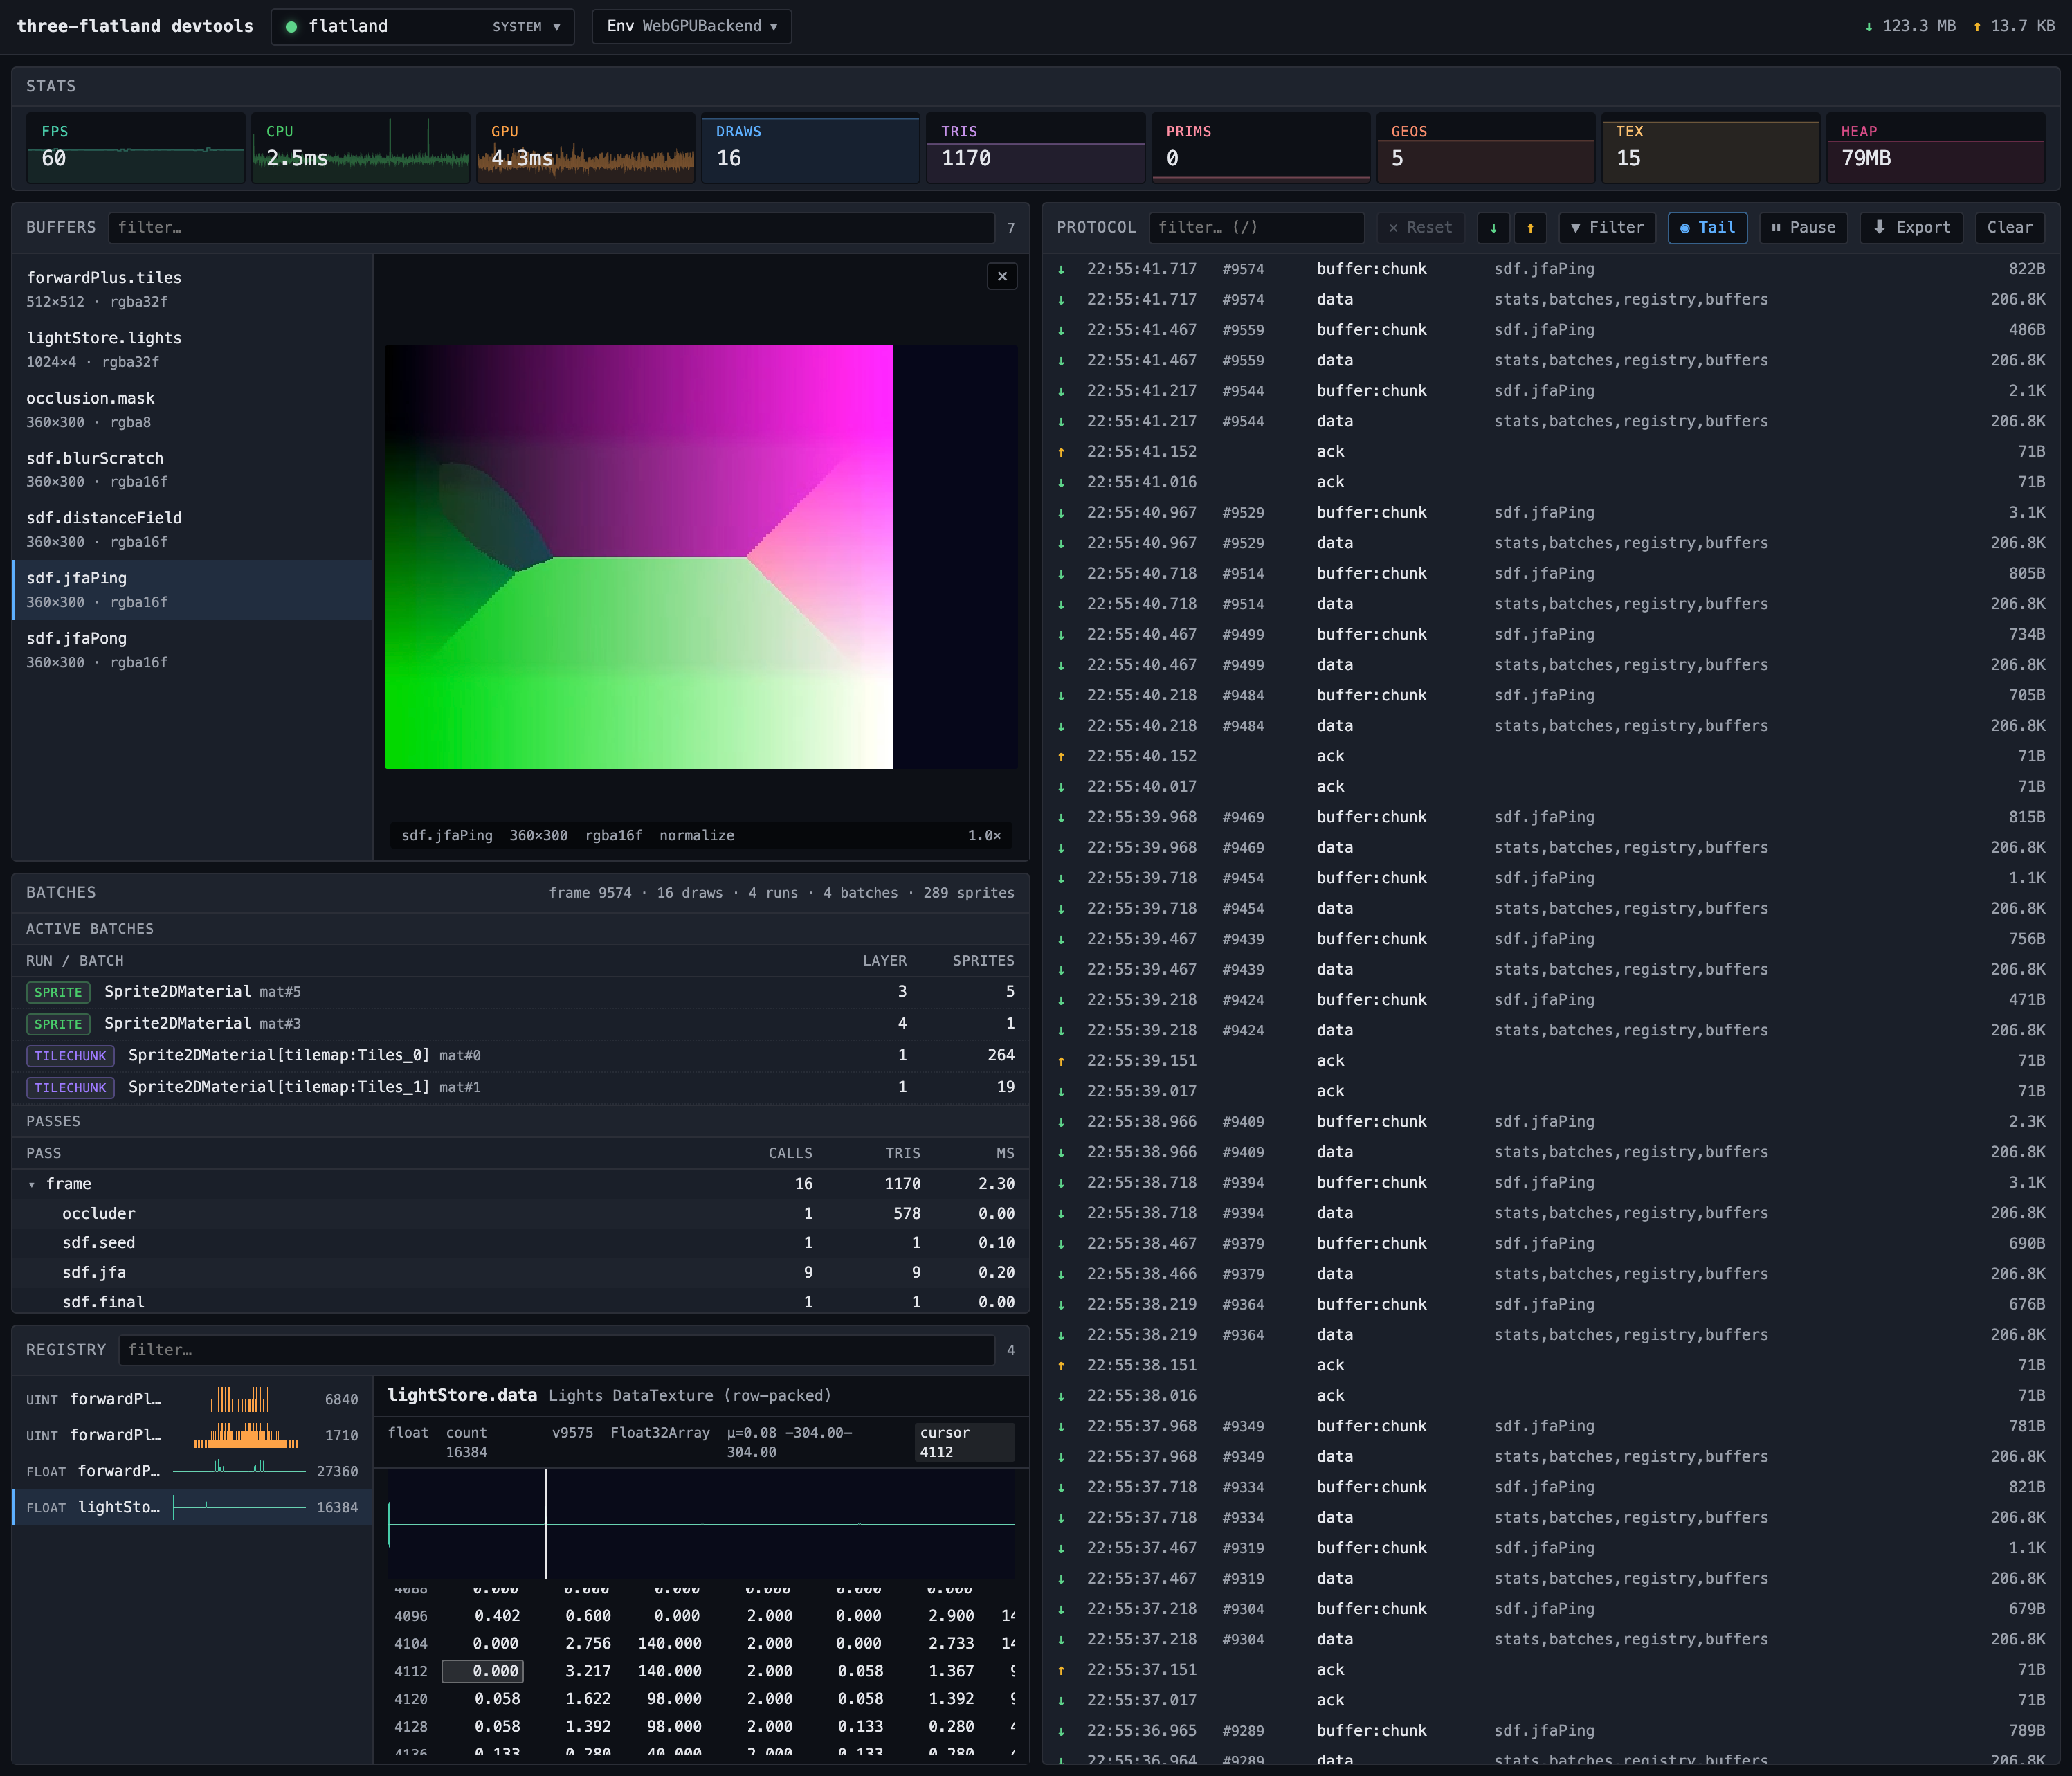
- Stats bar — FPS, CPU, GPU, draws, tris, geos, tex, heap with sparklines
- Buffers — registered CPU arrays, click an entry to preview
- Texture preview — selected DataTexture or RenderTarget rendered live
- Batches — active sprite batches grouped by material with pass breakdown
- Registry + LightStore.data — registered debug arrays with histograms
- Protocol log — bus traffic stream, filterable and pausable
Vite Plugin Setup
Section titled “Vite Plugin Setup”The dashboard is served as middleware by your Vite dev server. Add the plugin to your vite.config.ts:
import { defineConfig } from 'vite'import { threeFlatlandDevtools } from '@three-flatland/devtools/vite'
export default defineConfig({  plugins: [    threeFlatlandDevtools(),    // ...your other plugins  ],})
That’s it. Run vite dev and open the dashboard at http://localhost:<port>/.devtools — the plugin logs the URL on startup.
Options
Section titled “Options”threeFlatlandDevtools({ path: '/.devtools', // URL the dashboard mounts under (default)})| Option | Default | Description |
|---|---|---|
path | '/.devtools' | URL path the dashboard is served under. Change if /.devtools collides with one of your app routes. |
Scene-Side Wiring (Flatland)
Section titled “Scene-Side Wiring (Flatland)”Flatland users have nothing to wire up. When DEVTOOLS_BUNDLED is true (Vite sets import.meta.env.DEV in dev) and isDevtoolsActive() returns true at runtime, Flatland constructs its own DevtoolsProvider in its constructor and pumps stats into the bus on every flatland.render(renderer) call:
import { Flatland } from 'three-flatland'import { WebGPURenderer } from 'three/webgpu'
const renderer = new WebGPURenderer()await renderer.init()
const flatland = new Flatland({ viewSize: 400 })// ...add sprites, lights, passes...
function animate() {  requestAnimationFrame(animate)  flatland.render(renderer) // begin/end frame happens inside}animate()
import { Canvas, useFrame, useThree, extend } from '@react-three/fiber/webgpu'import { Flatland } from 'three-flatland/react'import { useRef } from 'react'import type { WebGPURenderer } from 'three/webgpu'
extend({ Flatland })
function Scene() { const flatlandRef = useRef(null) const renderer = useThree((s) => s.renderer) useFrame(() => { flatlandRef.current?.render(renderer as unknown as WebGPURenderer) }, { phase: 'render' }) return <flatland ref={flatlandRef} viewSize={80}>{/* ... */}</flatland>}
export default function App() { return ( <Canvas orthographic camera={{ zoom: 5, position: [0, 0, 100] }}> <Scene /> </Canvas> )}Open http://localhost:5173/.devtools (or wherever your Vite server is listening) and the dashboard discovers the Flatland-system provider automatically.
The runtime gate isDevtoolsActive() returns false when window.__FLATLAND_DEVTOOLS__ === false, giving you a per-page opt-out without rebuilding.
Scene-Side Wiring (Plain Three.js)
Section titled “Scene-Side Wiring (Plain Three.js)”If you’re driving three.js directly — no Flatland — call createDevtoolsProvider() from three-flatland and bracket your render call with beginFrame / endFrame:
import { createDevtoolsProvider } from 'three-flatland'import { WebGPURenderer } from 'three/webgpu'
const renderer = new WebGPURenderer()await renderer.init()
const devtools = createDevtoolsProvider({ name: 'my-app' })
function animate() {  requestAnimationFrame(animate)  devtools.beginFrame(performance.now(), renderer)  renderer.render(scene, camera)  devtools.endFrame(renderer)}animate()
// On teardown:devtools.dispose()
The handle exposes:
| Method | Description |
|---|---|
beginFrame(now, renderer) | Mark the start of a logical frame. now should be performance.now(). |
endFrame(renderer) | Mark the end of the frame. Resolves GPU timestamps and kicks any subscribed texture readbacks. |
dispose() | Tear down the bus connection. Idempotent. |
disposed | Becomes true after dispose(). |
Multi-pass renderers (SDF pass, occlusion pass, post-processing) work correctly: every renderer.render() between beginFrame and endFrame aggregates into one logical frame’s renderer.info delta — they don’t get counted as separate frames.
In production (when DEVTOOLS_BUNDLED is false), createDevtoolsProvider returns a no-op stub; beginFrame/endFrame/dispose all become empty calls that minify away.
In-Page Tweakpane Controls
Section titled “In-Page Tweakpane Controls”@three-flatland/devtools wraps Tweakpane v4 with a Flatland-themed pane that mounts directly into your page. Because it consumes the same bus as the standalone dashboard, the pane needs no scene wiring of its own — it discovers any provider the page has constructed and streams stats from it.
Installation
Section titled “Installation”npm install @three-flatland/devtools tweakpane @tweakpane/plugin-essentialspnpm add @three-flatland/devtools tweakpane @tweakpane/plugin-essentialsyarn add @three-flatland/devtools tweakpane @tweakpane/plugin-essentialsbun add @three-flatland/devtools tweakpane @tweakpane/plugin-essentialsPeer dependencies: three ^0.185.1, tweakpane ^4.0.5, @tweakpane/plugin-essentials ^0.2.1. For the React entry: @react-three/fiber 10.0.0-alpha.3, react ~19.2.0.
@three-flatland/devtools/react is browser-only on R3F alpha.3. Its upstream Inspector reads localStorage during module evaluation, so place the import behind your framework’s client boundary rather than evaluating it during SSR.
Two entry points:
@three-flatland/devtools— vanilla:createPane,DevtoolsClient,applyTheme,FLATLAND_THEME.@three-flatland/devtools/react— hooks:usePane,usePaneFolder,usePaneInput,usePaneButton,useFpsGraph.
What You Get
Section titled “What You Get”Calling createPane() (or usePane()) gives you:
- Collapsible header with a pin toggle — the pane dims while the cursor is elsewhere and pins fully opaque when clicked.
- Cycling stats graph — click to cycle
fps → ms → gpu → mem. GPU mode only shows up when the renderer supports timestamp queries (see below). Values are interpolated between batches so the polyline scrolls smoothly rather than stepping 4× per second. - Compact stats row — five columns:
draws · triangles · primitives · geometries · textures, auto-formatted (1.2K,10M). - Multi-provider switcher — a
◀ name ▶blade that appears automatically when two or more providers are present on the bus. - Flatland theme matching the docs aesthetic.
There are no extra wiring calls. The pane has zero knowledge of your scene, your renderer, or your frame loop — it discovers a provider on the bus and streams stats. If your app already constructs a Flatland (or calls createDevtoolsProvider per the section above), the pane just works.
Three.js Usage
Section titled “Three.js Usage”import { WebGPURenderer } from 'three/webgpu'import { createPane } from '@three-flatland/devtools'
const renderer = new WebGPURenderer()await renderer.init()
const { pane, update: updateDevtools } = createPane({ driver: 'manual' })
const params = { speed: 1.0, color: '#99d9ef' }pane.addBinding(params, 'speed', { min: 0, max: 5 })pane.addBinding(params, 'color')
function animate() { requestAnimationFrame(animate) flatland.render(renderer) // or your own renderer.render() call updateDevtools() // drives the graph's interpolation RAF}animate()driver: 'manual' disables the pane’s fallback requestAnimationFrame; you drive the graph from your existing loop, avoiding a second rAF (which Safari throttles on backgrounded tabs). If you omit driver, the pane starts its own rAF and update() becomes a no-op — fine for quick throwaway apps, preferred to avoid in anything production-shaped.
GPU timing
Section titled “GPU timing”You don’t enable GPU timing yourself. When devtools is active the provider opts the renderer into timestamp queries on its own; when devtools is off no queries are issued, so production builds never accumulate an undrained query pool. Don’t pass trackTimestamp: true on the renderer.
On WebGPU, the adapter must expose GPUFeatureName.TimestampQuery (most desktop browsers). On WebGL2, EXT_disjoint_timer_query_webgl2 must be present. Values trail by ~1 frame because the readback is async. The pane silently hides gpu from the mode cycle when unsupported.
React Usage
Section titled “React Usage”The React hook is R3F-aware: it internally forces driver: 'manual' and registers a useFrame(update, 1000) at a late priority so the graph tick runs AFTER R3F’s auto-render, capturing the true end-of-frame renderer.info.
import { Canvas, useFrame } from '@react-three/fiber/webgpu'import {  usePane,  usePaneFolder,  usePaneInput,  usePaneButton,} from '@three-flatland/devtools/react'
function Scene() {  const { pane } = usePane()
  const folder = usePaneFolder(pane, 'Sprite')  const [speed] = usePaneInput(folder, 'speed', 1.0, { min: 0, max: 5 })  const [color] = usePaneInput(folder, 'color', '#99d9ef')  usePaneButton(folder, 'Reset', () => console.log('reset'))
  useFrame((_, delta) => {    // use `speed` / `color` — each input change triggers a React re-render  })
  return <>{/* sprites, meshes */}</>}
export default function App() { return ( <Canvas> <Scene /> </Canvas> )}React hook reference
Section titled “React hook reference”| Hook | Purpose |
|---|---|
usePane(options?) | Create the pane. Returns { pane, update }. Internally runs useFrame(update, 1000) — you don’t need to call update yourself. |
usePaneFolder(parent, title, options?) | Collapsible folder. Returns FolderApi. |
usePaneInput(parent, key, initial, options?) | Bind an input. Returns [value, setValue] — each change triggers a React re-render. |
usePaneButton(parent, title, onClick) | Button blade. Uses a callback ref so onClick is never stale. |
useFpsGraph(parent) | Standalone cycling stats graph when you aren’t using usePane. |
All hooks create bindings synchronously during render (so controls appear without pop-in) and defer disposal across React Strict Mode’s cleanup / re-mount cycle.
Bus Architecture (for the curious)
Section titled “Bus Architecture (for the curious)”The pane, the dashboard, and the provider all communicate via two BroadcastChannels:
- Discovery channel (
flatland-debug) — carries onlyprovider:announce/provider:query/provider:gone. Lightweight, shared by everyone. - Per-provider data channel (
flatland-debug:<providerId>) — one per provider. Carriessubscribe/subscribe:ack/ack/unsubscribe/data/ping. Scoped by name so subscribers only see their chosen provider’s traffic; providers don’t field unrelated clients’ messages.
Stats samples are collected per frame into pre-allocated typed-array ring buffers on the provider side (scaled encodings: fps × 10 as Int16, ms × 100 as Uint16, counts as Uint32) and flushed in batches every STATS_BATCH_MS (default 250 ms). The client decodes into Float32 rings on arrival and exposes both a per-frame series (for the polyline) and a scalar batch mean (for the text label — naturally smoothed).
The graph’s RAF reads from those rings and slides the visible window through the newest samples over the inter-batch window, producing smooth motion from a 4 Hz batch stream.
import { Pane } from 'tweakpane'import { applyTheme, FLATLAND_THEME } from '@three-flatland/devtools'
const pane = new Pane({ title: 'Controls' })applyTheme(pane.element, FLATLAND_THEME)
applyTheme sets CSS custom properties on the pane element — fork FLATLAND_THEME (it’s a plain object) to tweak colours without touching the package.
Pane Options
Section titled “Pane Options”createPane({ title: 'Controls', // Pane header title (default: 'Controls') expanded: true, // Initial expansion state (default: true) driver: 'manual', // 'manual' (caller drives update()) or 'raf' (fallback rAF) container, // Custom container element (optional)})Dashboard Panels
Section titled “Dashboard Panels”The dashboard renders four panels driven by feature subscriptions. Each panel is independently subscribable — collapse a panel and its data stops being collected on the producer side too.
Stats panel
Section titled “Stats panel”A grid of cards, one per counter. Each card shows the current value and a sparkline of recent samples:
| Counter | What it measures |
|---|---|
fps | End-to-end frame rate from endFrame intervals. |
cpu | endFrame - beginFrame (full frame CPU cost). |
gpu | GPU timestamp delta — — unless the adapter supports timestamp queries (devtools enables tracking itself when active). |
draws | renderer.info.render.calls delta over the frame. |
tris | Triangle count. |
prims | Primitive count. |
geos | Live BufferGeometry count. |
tex | Live Texture count. |
heap | JS heap used (Chromium only — falls back to — elsewhere). |
Click a card to open a detail histogram with min, p50, mean, p95, p99, and max over the recent window.
Batches panel
Section titled “Batches panel”Live list of active sprite batches grouped by material, plus per-batch counts and any kind / label annotations the engine attaches (e.g. chunk(0,2) for tile chunks). Useful for confirming that sprites you expect to share a material actually do — see the Batch Rendering guide for the underlying behavior.
Buffers panel
Section titled “Buffers panel”Registered CPU arrays — Float32Array, Uint32Array, Int32Array. Each entry shows its label, length, kind (float / uint / int), and a small histogram. The engine itself uses this to expose tile-light counts, scoring buffers, and similar internal state; you can register your own (see below).
Texture registry
Section titled “Texture registry”Registered DataTexture and RenderTarget outputs, viewable as images. Readbacks are async — the dashboard only triggers them when a texture is selected for preview, so leaving things registered is free until somebody actually opens the panel.
Custom Debug Instrumentation
Section titled “Custom Debug Instrumentation”Anything your scene already keeps in CPU memory or in a render target can show up in the dashboard. The register* calls are no-op when devtools isn’t bundled, so they’re safe to leave permanently in engine code.
CPU arrays
Section titled “CPU arrays”Use registerDebugArray once, then touchDebugArray whenever you mutate the contents in place. Don’t allocate a new buffer per frame — pass a stable reference and let the registry pick up changes:
import {  registerDebugArray,  touchDebugArray,  unregisterDebugArray,} from 'three-flatland'
const tileCounts = new Uint32Array(numTiles)
registerDebugArray('forwardPlus.tileCounts', tileCounts, 'uint', {  label: 'Forward+ tile light counts',})
function updateTiles() {  // ...mutate tileCounts in place...  touchDebugArray('forwardPlus.tileCounts')}
// On dispose:unregisterDebugArray('forwardPlus.tileCounts')| Argument | Type | Notes |
|---|---|---|
name | string | Stable identifier — also the key passed to touch* / unregister*. |
ref | Float32Array | Uint32Array | Int32Array | Held by reference; the registry reads it lazily on flush. |
kind | 'float' | 'uint' | 'int' | Drives the dashboard’s histogram + formatting. |
opts.label | string? | Human-readable label shown in the panel. |
opts.length | number? | Logical length when the typed array is over-sized (capacity vs. live count). |
Textures and render targets
Section titled “Textures and render targets”Same pattern, with registerDebugTexture / touchDebugTexture / unregisterDebugTexture. Accepts a DataTexture directly, or any { width, height, texture } object — RenderTargets satisfy that shape:
import {  registerDebugTexture,  touchDebugTexture,  unregisterDebugTexture,} from 'three-flatland'
// CPU-backed textureregisterDebugTexture('lightStore.lights', lightsDataTexture, 'rgba32f', {  label: 'Lights DataTexture',})
// Render target (any object with width/height/texture)registerDebugTexture('shadowMap', shadowRT, 'rgba16f', {  label: 'Shadow trace output',  display: 'colors',})
function updateLights() {  // ...write to the texture...  touchDebugTexture('lightStore.lights')}
Pixel types: 'rgba8' (default) | 'rgba16f' | 'rgba32f' | 'r32f' | 'r32u' | 'r32i'. Display modes hint at how the dashboard should render the data (heatmap vs. raw colors).
How the engine itself uses this
Section titled “How the engine itself uses this”The lighting and tile pipelines lean on the same APIs. Treat them as canonical examples:
LightStoreregisters'lightStore.data'(the row-packed Float32 backing array) and'lightStore.lights'(the DataTexture itself), then callstouchDebugArray/touchDebugTextureafter every write.ForwardPlusLightingregisters per-tile light counts, scoring buffers, and fill-in-range arrays — handy when tuning the per-category fill quotas, because the dashboard surfaces exactly which buckets are saturated.
Both unregister on dispose to keep the registry tidy across hot-reloads.
Production Gating
Section titled “Production Gating”Two layers turn the entire devtools subsystem off:
Build-time: DEVTOOLS_BUNDLED
Section titled “Build-time: DEVTOOLS_BUNDLED”A module-scoped const evaluated from import.meta.env.DEV and import.meta.env.VITE_FLATLAND_DEVTOOLS at build time. When both are falsy, the constant folds to false, every if (DEVTOOLS_BUNDLED) { ... } branch becomes dead code, and terser removes it. The Tweakpane theme, the bus transport, the readback paths — none of it ends up in your production bundle.
| Build flag | window.__FLATLAND_DEVTOOLS__ | Result |
|---|---|---|
DEV=true or VITE_FLATLAND_DEVTOOLS=true | undefined | Enabled (default on in dev) |
DEV=true or VITE_FLATLAND_DEVTOOLS=true | false | Disabled at runtime |
DEV=true or VITE_FLATLAND_DEVTOOLS=true | true | Enabled (explicit) |
| Neither | (anything) | Dead code — not in bundle |
You can force-enable devtools in a non-dev environment by setting VITE_FLATLAND_DEVTOOLS=true in .env.production or similar — useful for staging builds where you want the dashboard available without DEV semantics.
Runtime: isDevtoolsActive()
Section titled “Runtime: isDevtoolsActive()”Only reachable when DEVTOOLS_BUNDLED is true. Reads window.__FLATLAND_DEVTOOLS__ as an opt-out — set it to false before three-flatland loads and Flatland skips constructing its provider, even though the code is in the bundle. You can flip it per-page:
<script>window.__FLATLAND_DEVTOOLS__ = false</script>This is a one-way switch: rogue clients can’t enable devtools that wasn’t bundled, so it’s safe even if __FLATLAND_DEVTOOLS__ somehow leaks into a production bundle.
Next Steps
Section titled “Next Steps”- Pass Effects guide — Many of the lighting fields you’ll see in the dashboard come from
DefaultLightEffect’s schema. - Batch Rendering guide — Background for what the dashboard’s Batches panel is showing you.
- Basic Sprite example — See
createPane+driver: 'manual'in context. - Pass Effects example — Same pattern inside a custom render phase.